

 Deutsch
 Español
 Français
 Hrvatski
 Italiano
 Polski
 Português (BR)
Creating Boards for Statistics
Overview
Create boards to group your charts. Each statistics board can have up to 10 full-width charts or 20 half-width charts.
Access & Permissions
How to access Statistics
- Click Statistics

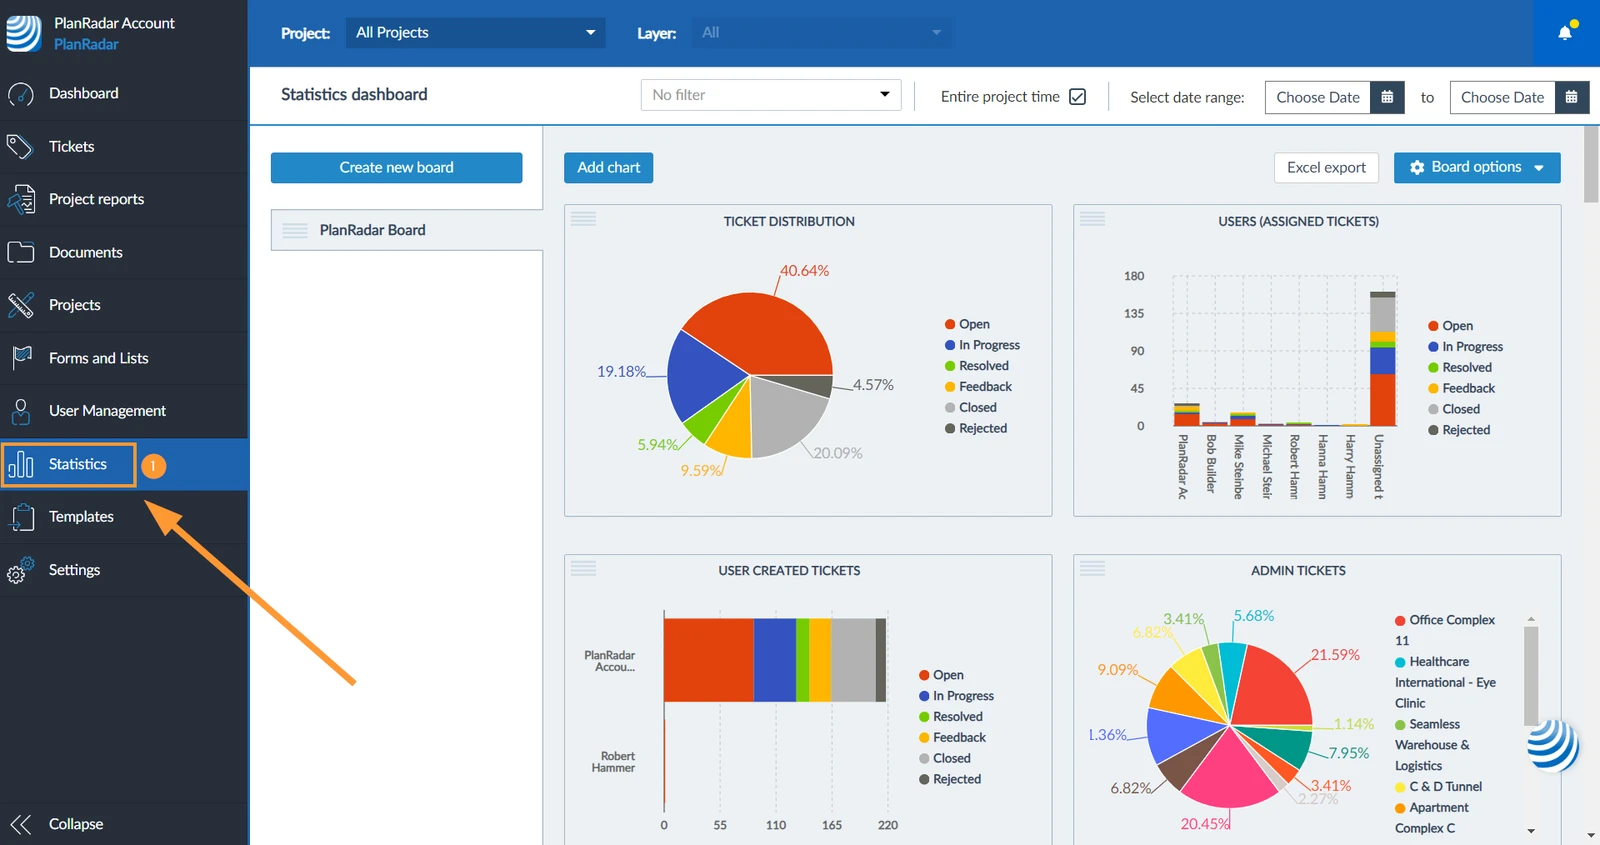
Create a Board
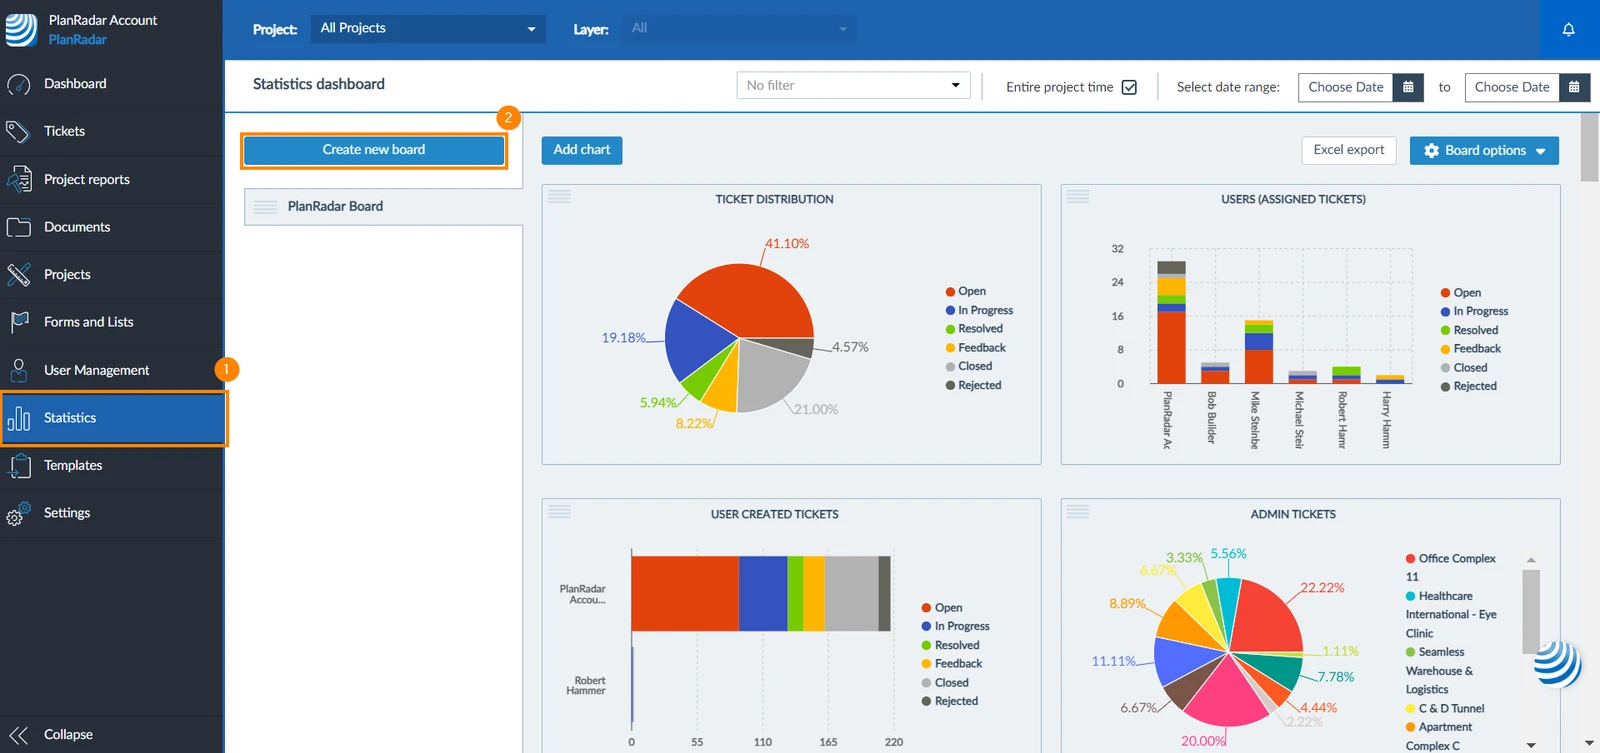
To create a new statistics board:
- Click Statistics
- Click Create new board
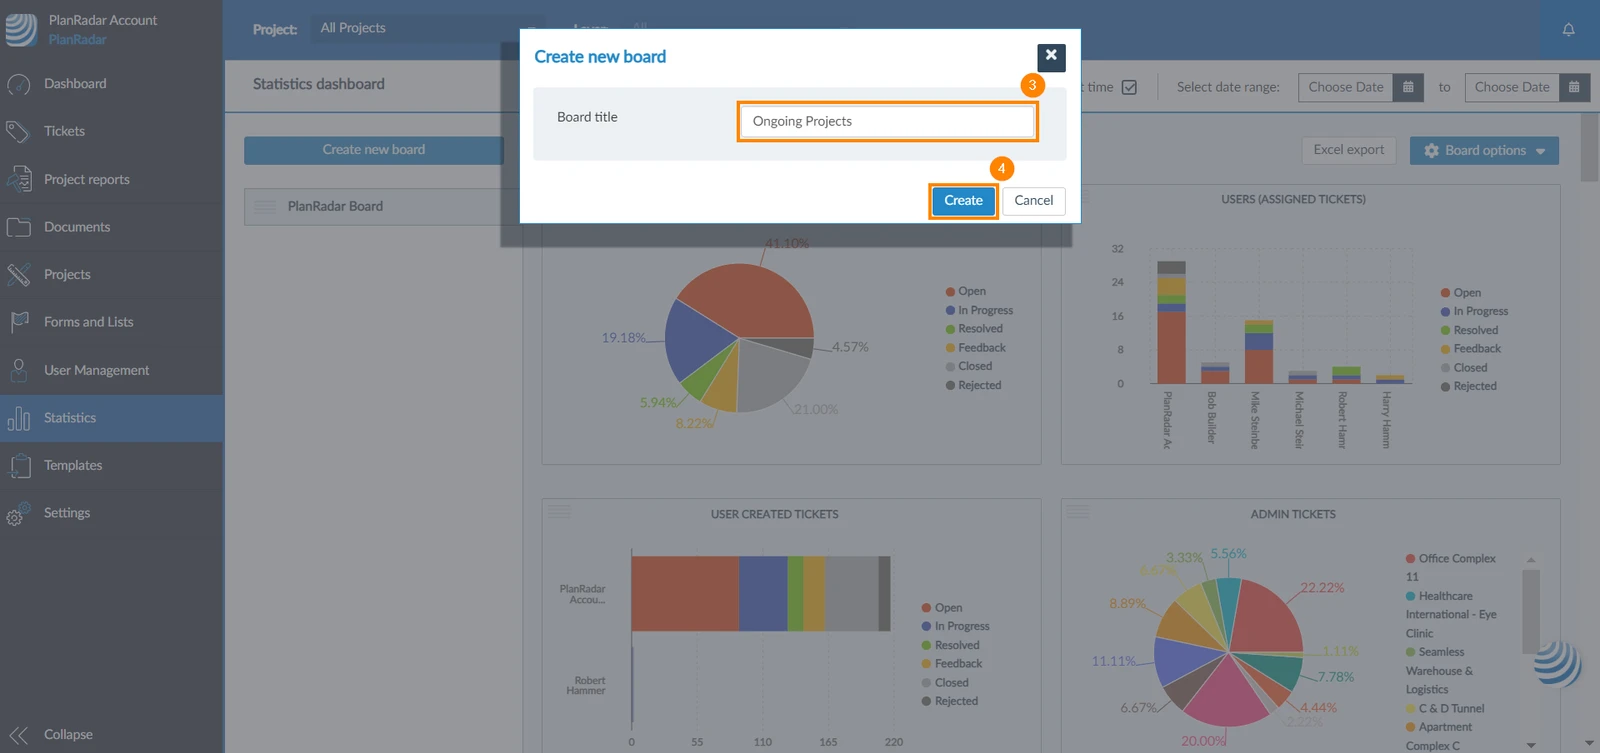
- Enter the board title
- Click Create
- Add charts
Rename Board
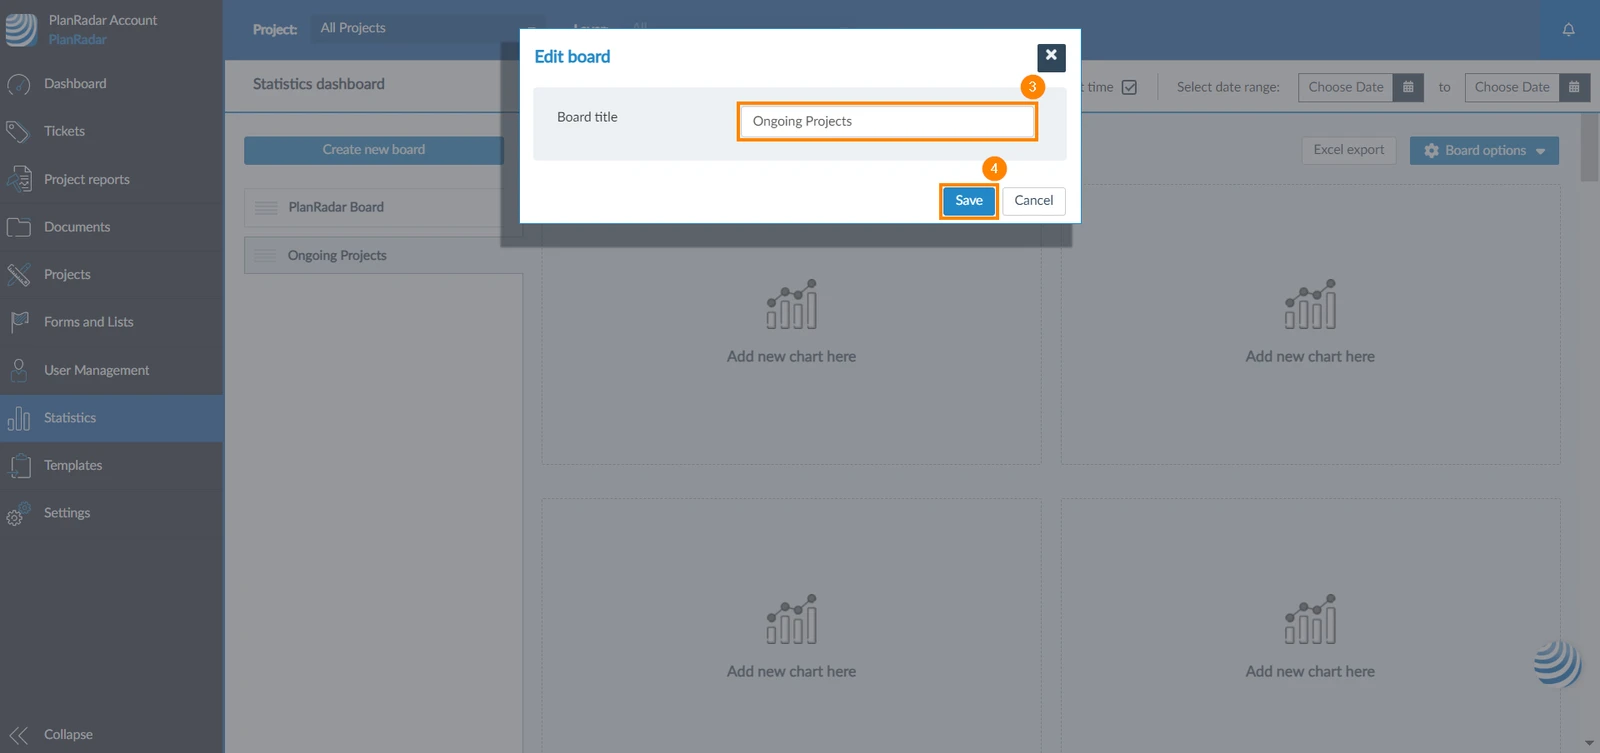
To change the title of the statistics board:
- Click Board options
- Click Edit board
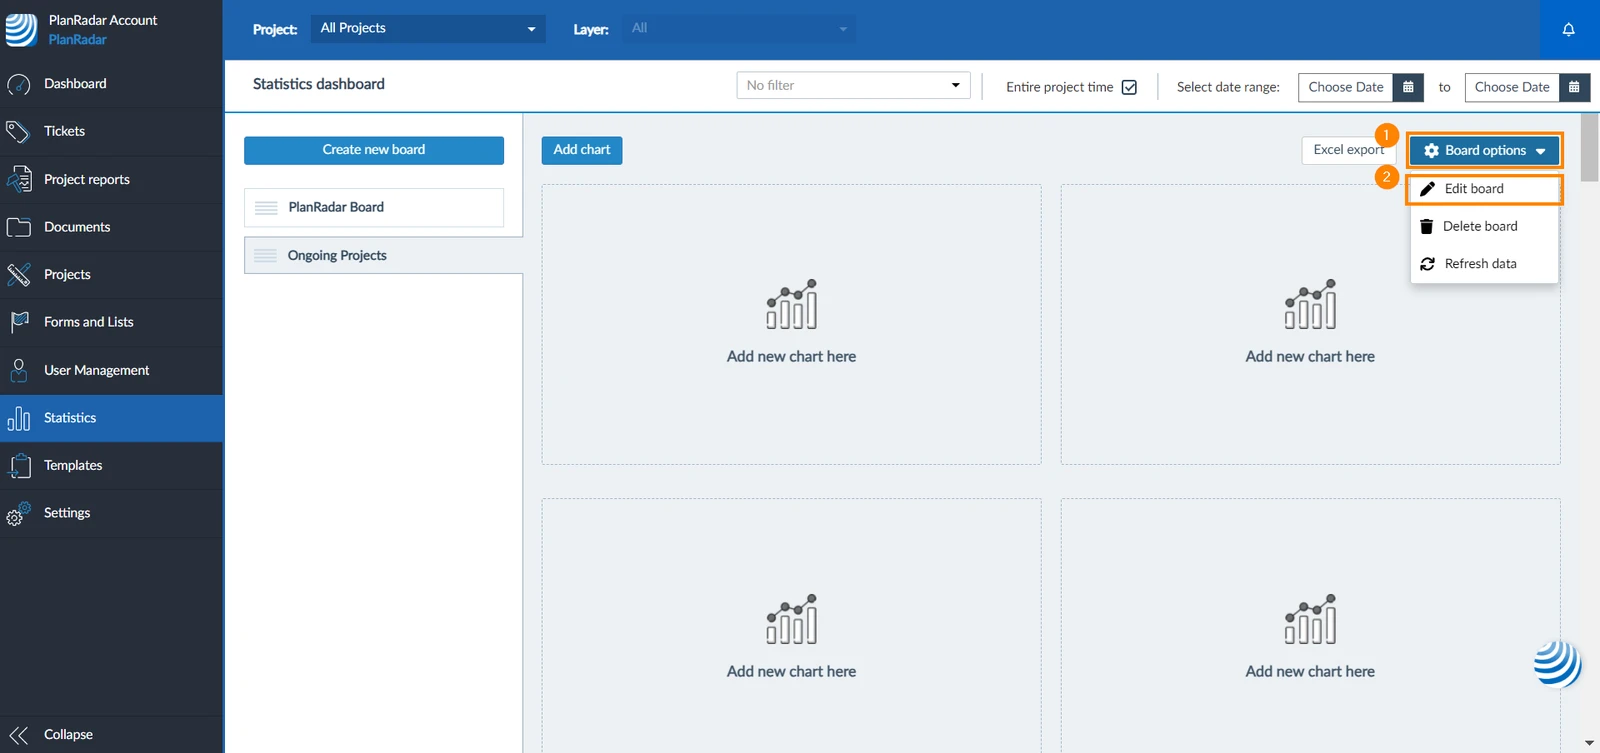
- Edit the title
- Click Save
Rearrange Charts in Statistics Board
You can move charts within your board to rearrange their position. To do so:
- Click the icon on the top left corner of the chart
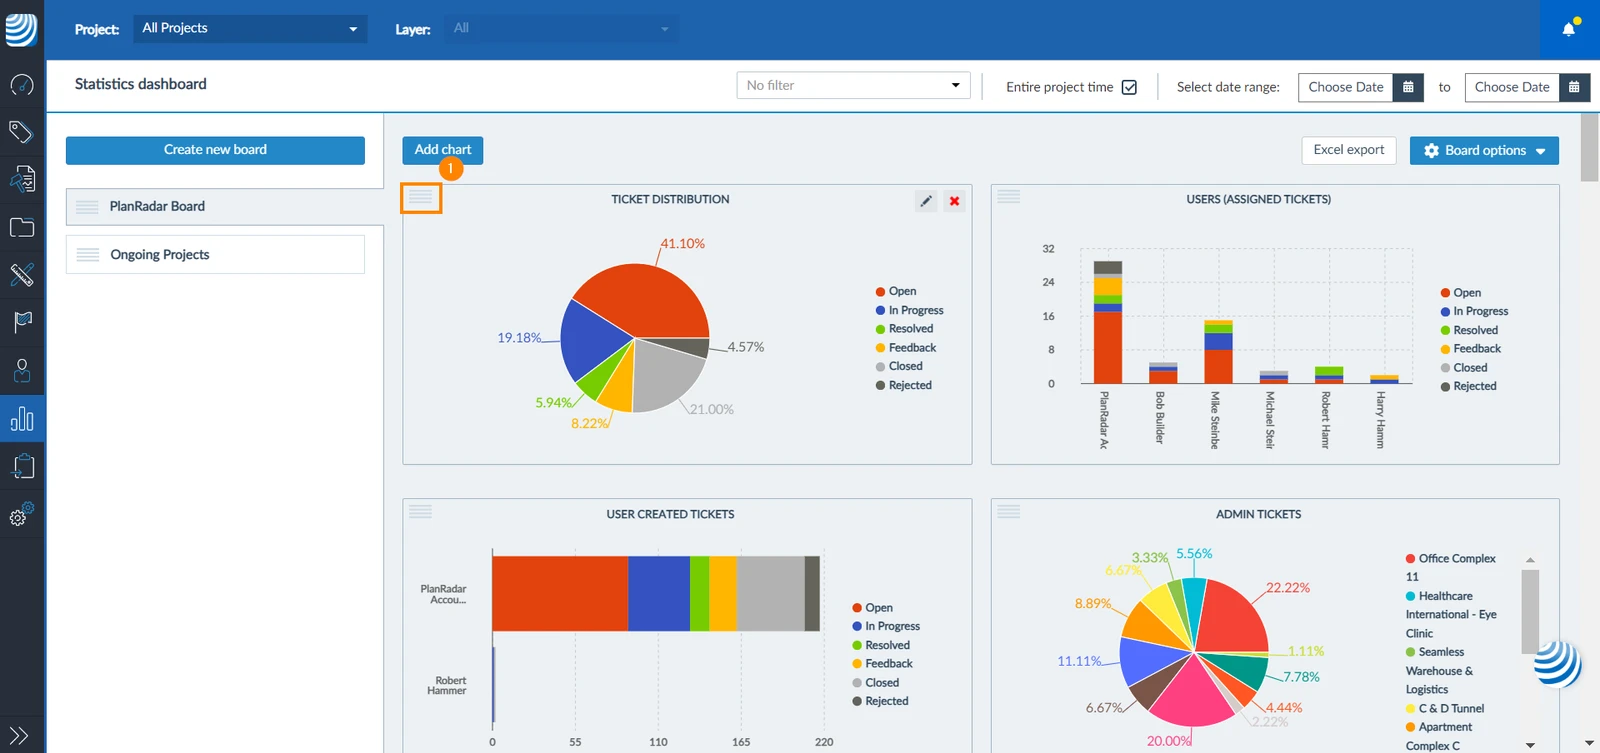
- Drag the chart and drop it on its new place
Refresh Board
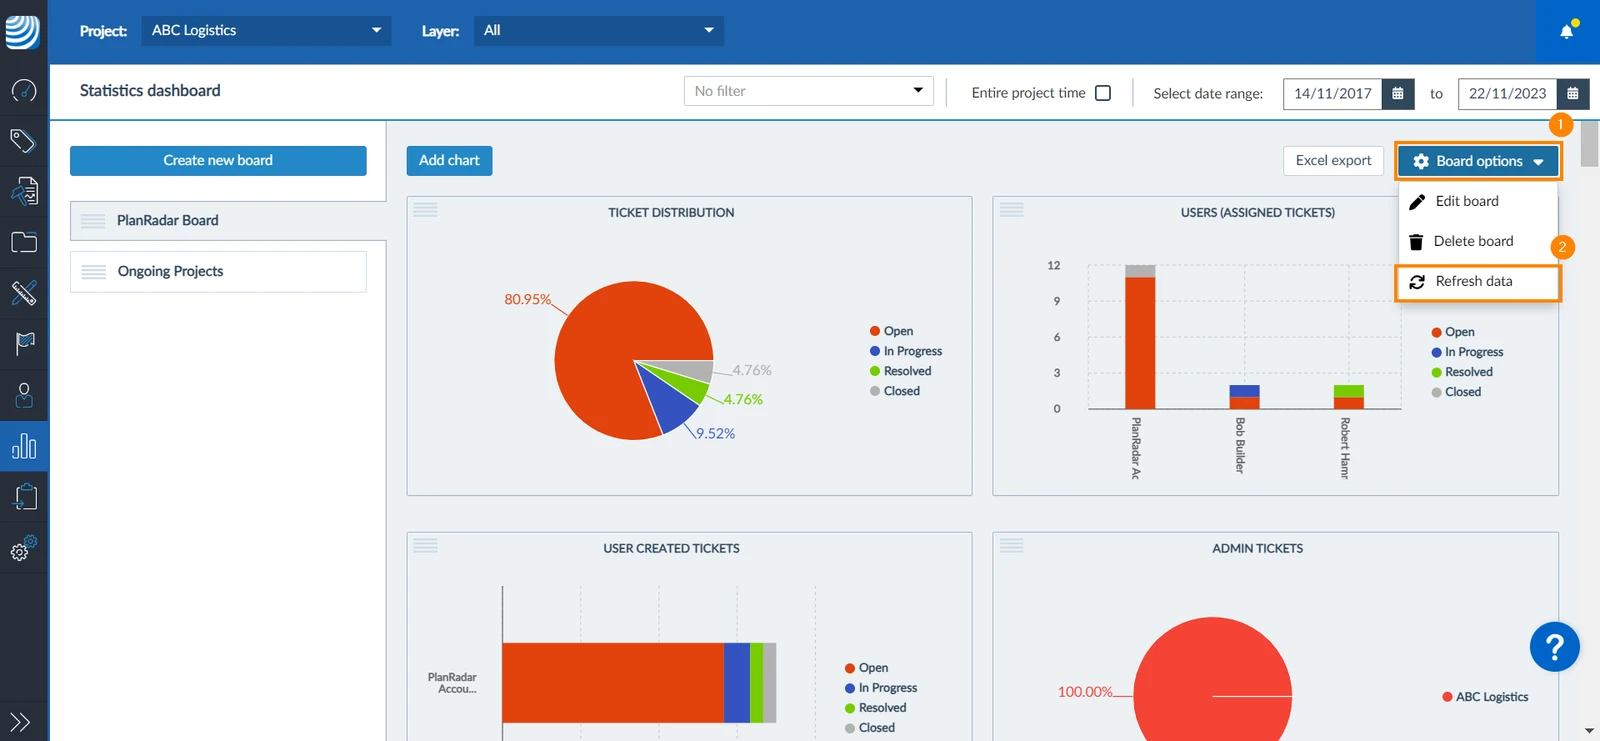
The statistics data might be cached for a few minutes to improve the user experience. To see the latest data, refresh the board:
- Click Board options
- Click Refresh data
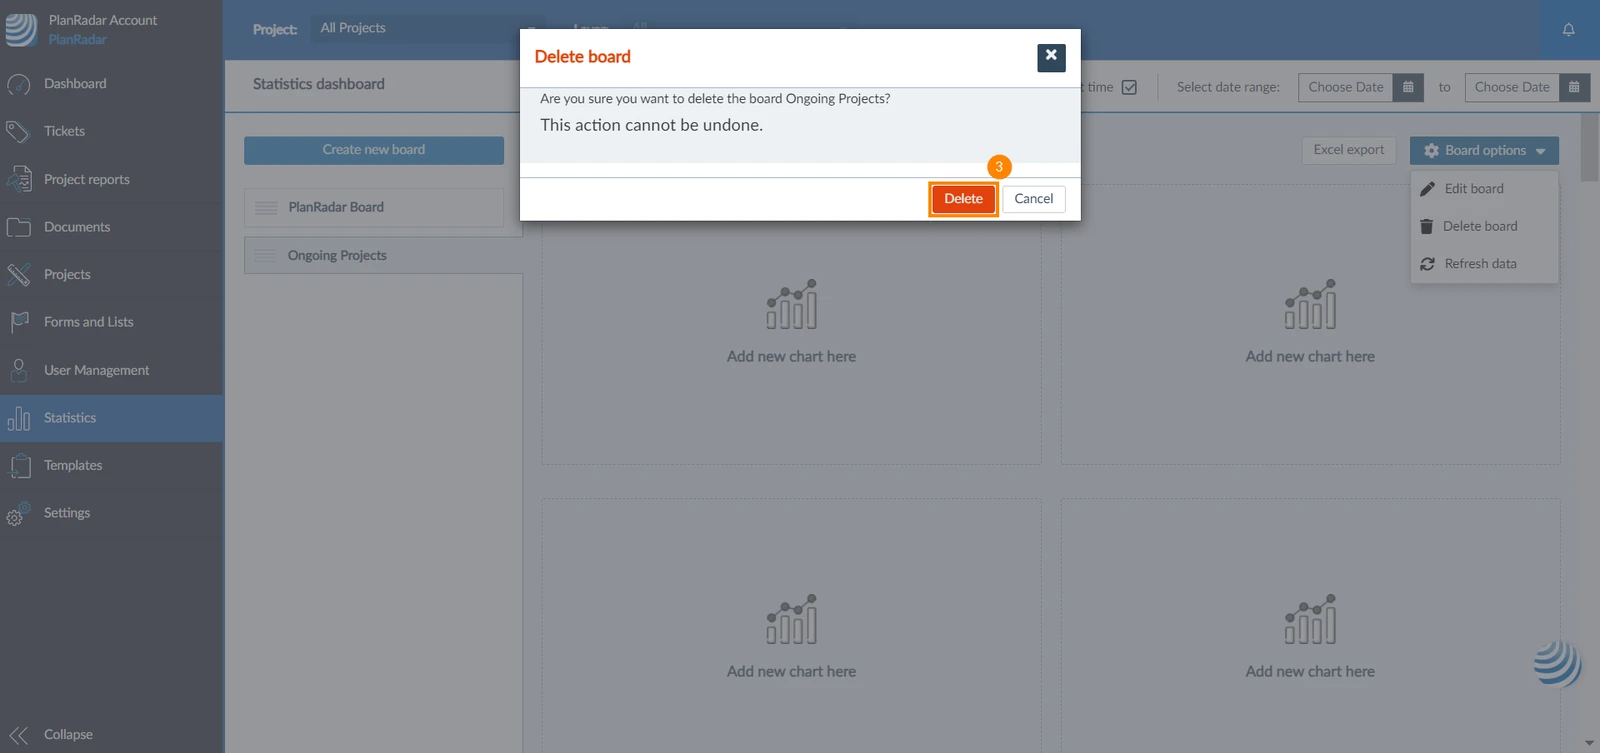
Delete Board
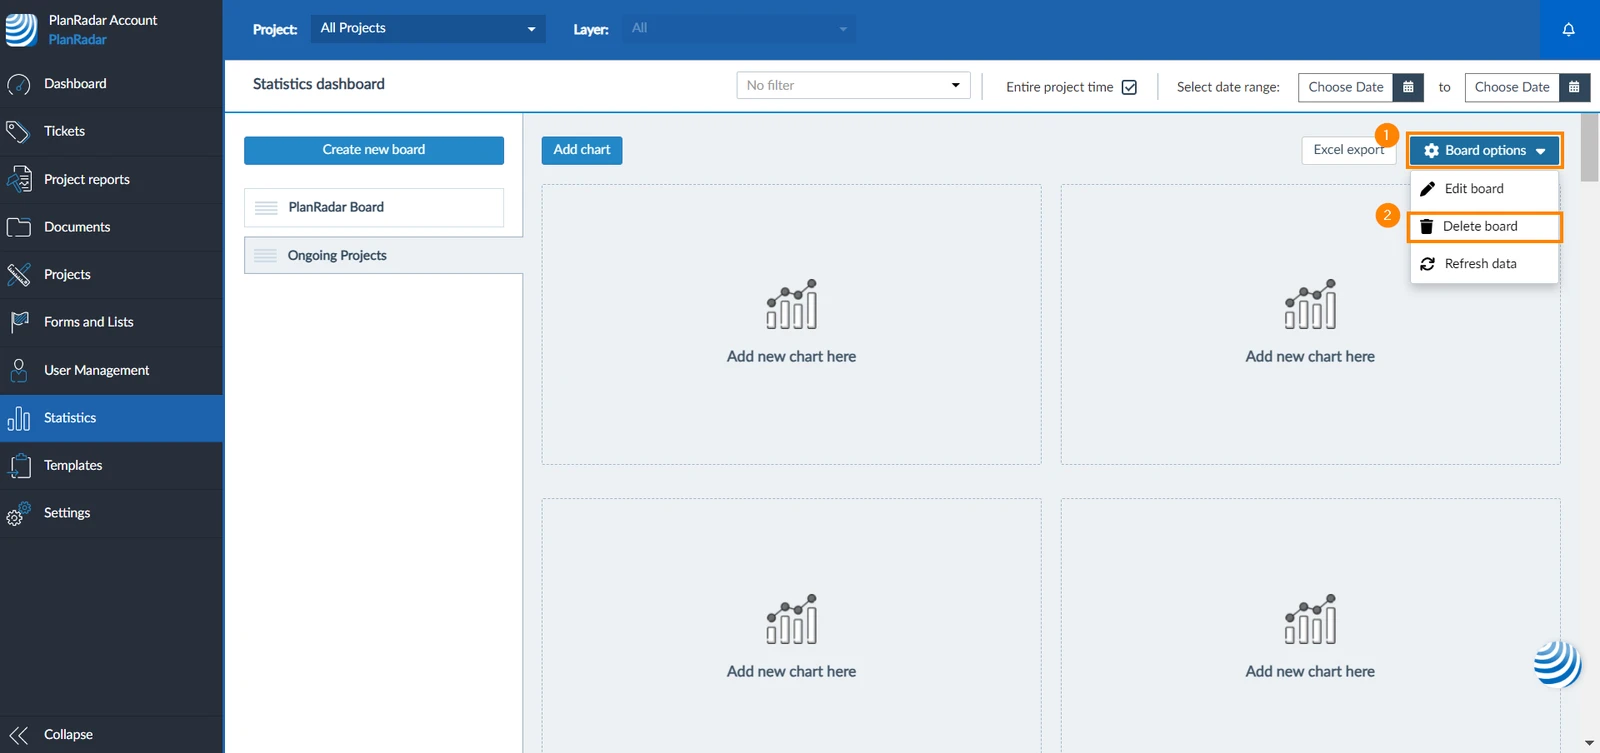
To delete a board:
- Click Board options
- Click Delete board
- Click Delete to confirm the deletion of the board
Related Articles
Updated May 21, 2026