

 Deutsch
 Español
 Français
 Hrvatski
 Italiano
 Polski
 Português (BR)
User Metrics
Overview
Get an overview of users' behavior in your PlanRadar account to better understand how users work in your account and to drive business growth.
You can export all the user metrics data of the last 365 days in an Excel file. You can analyse or visualise the data in Excel, Power BI, or other tools. Read more below in Download User Metrics Data.
Access & permissions
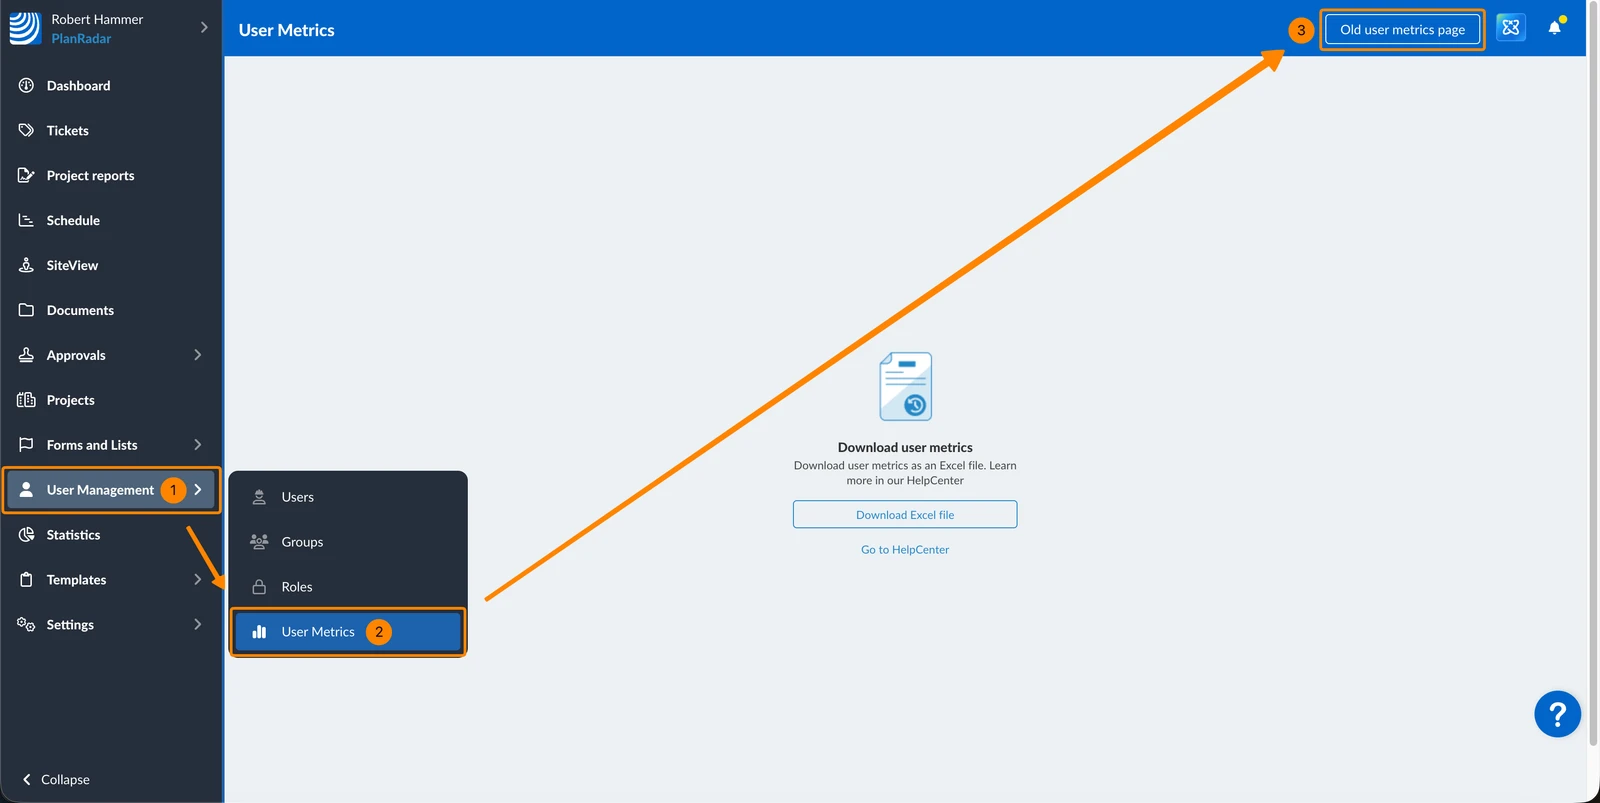
Download User Metrics (New Page)
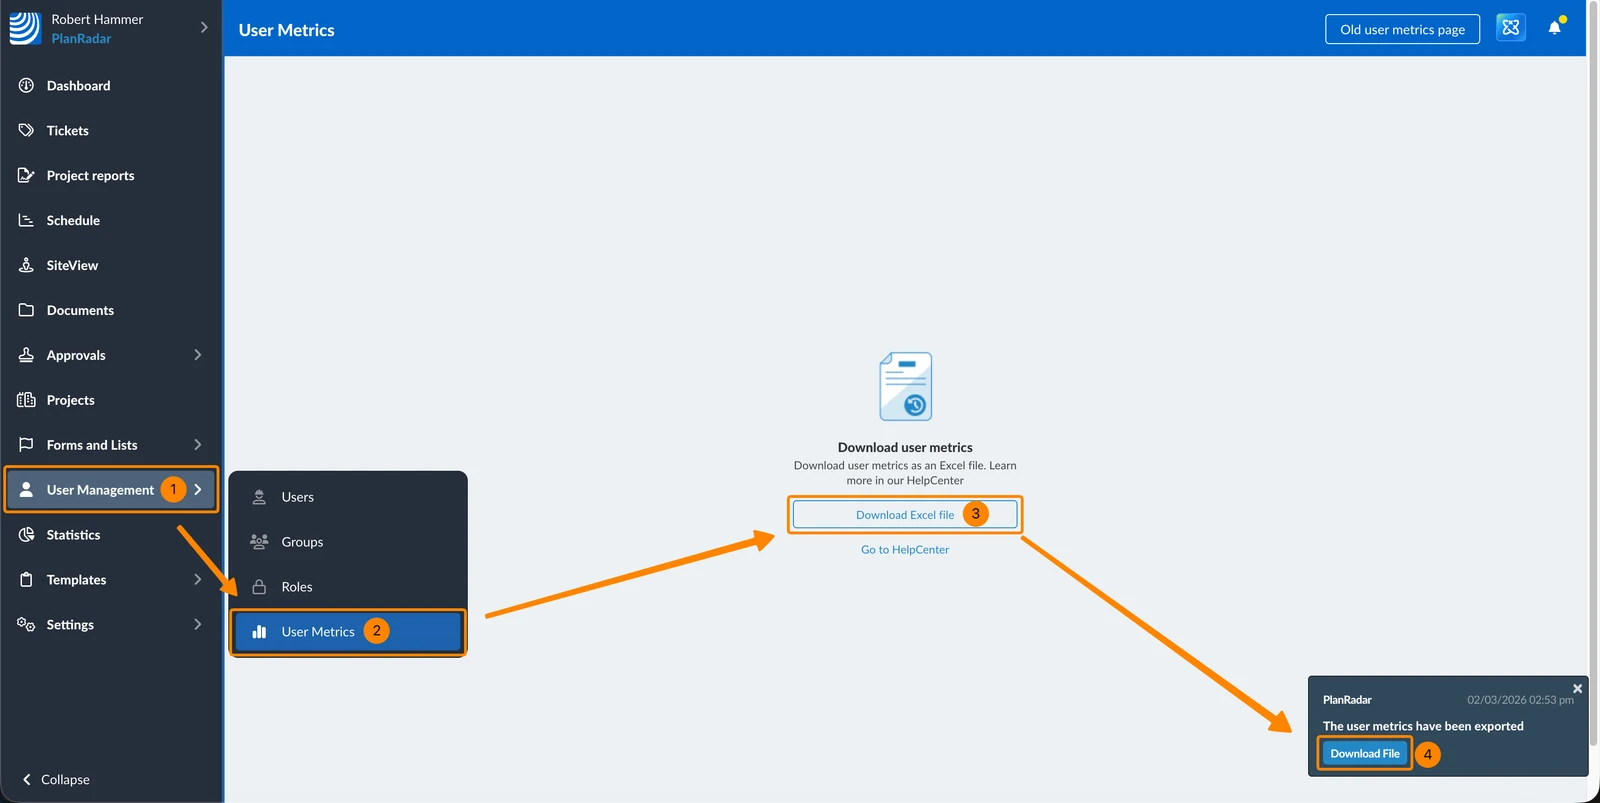
To download user metrics data in an Excel file:
- Click User Management
- Click User Metrics
- Click Download Excel file
- Once the file is ready to be downloaded, you will get a notification. Click Download File
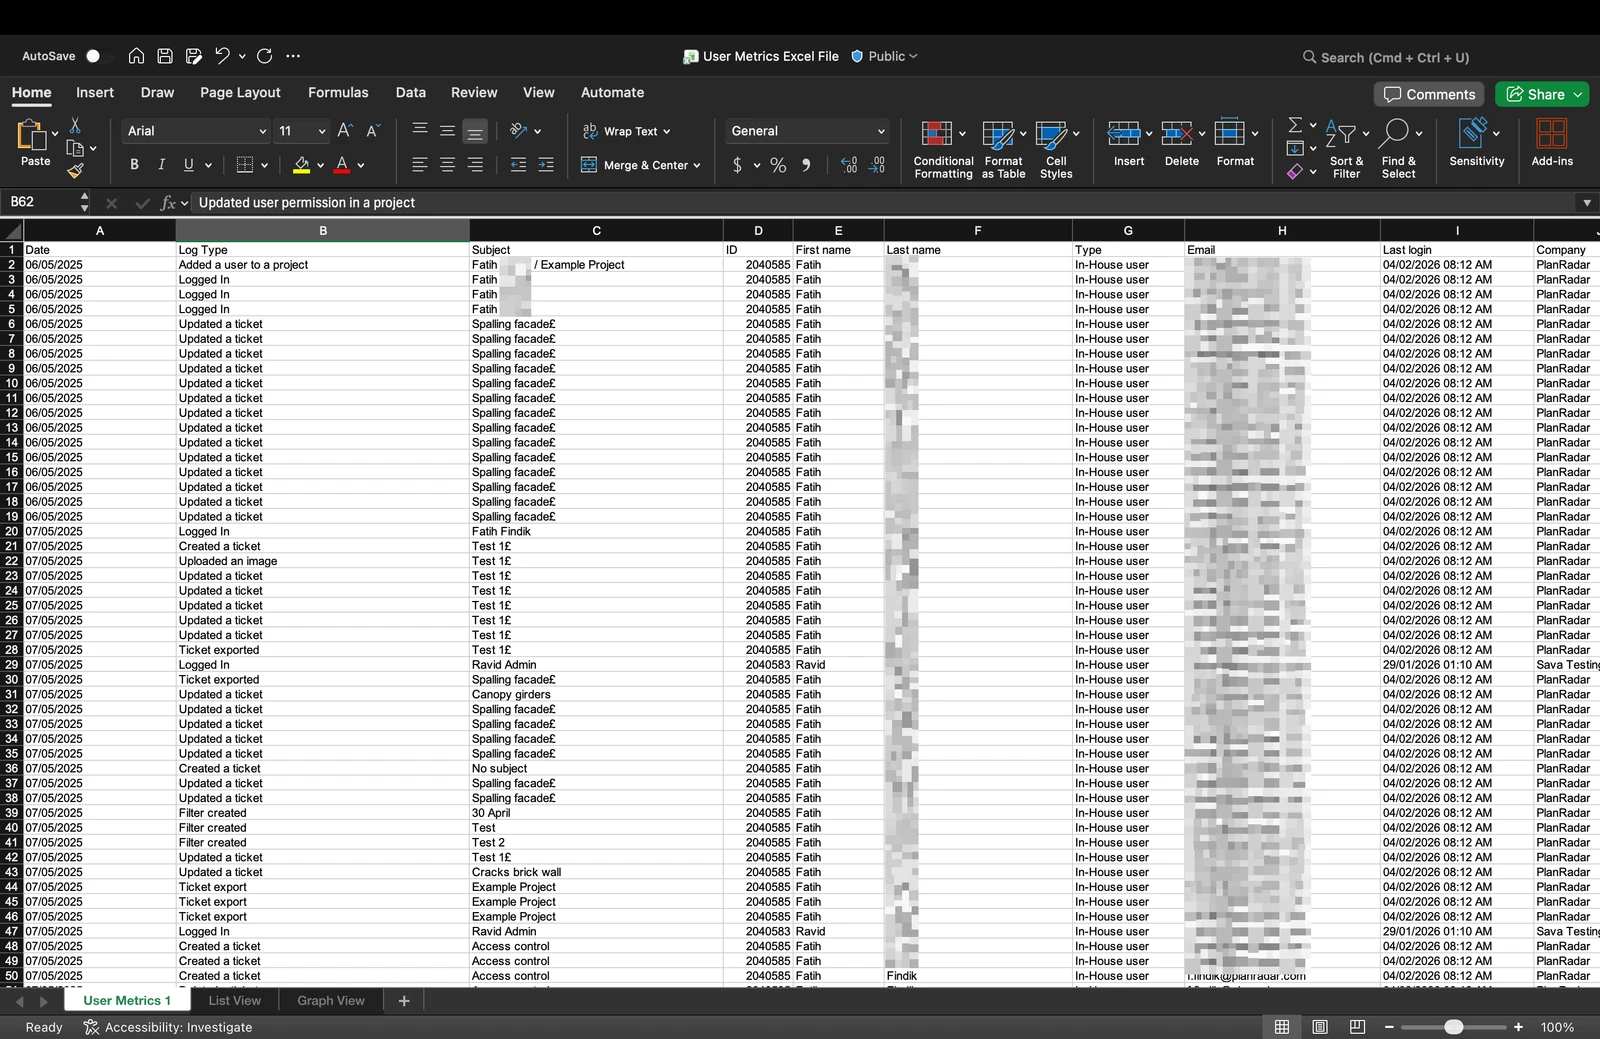
The Excel file contains a list of all logged events with the following columns:
- Date (Date and time of the event)
- Log Type (e.g. Logged in, Updated a ticket, Ticket signed, Approval request created, File approved,...)
- Subject (First name and last name of the user)
- ID (of the user)
- First name
- Last name
- Type (user type)
- Last login
- Company
- Position
- Street
- Zip code
- City
- Phone
Example of user metrics Excel file:
Review and Analyze Your Data in Excel
In Excel you could for example:
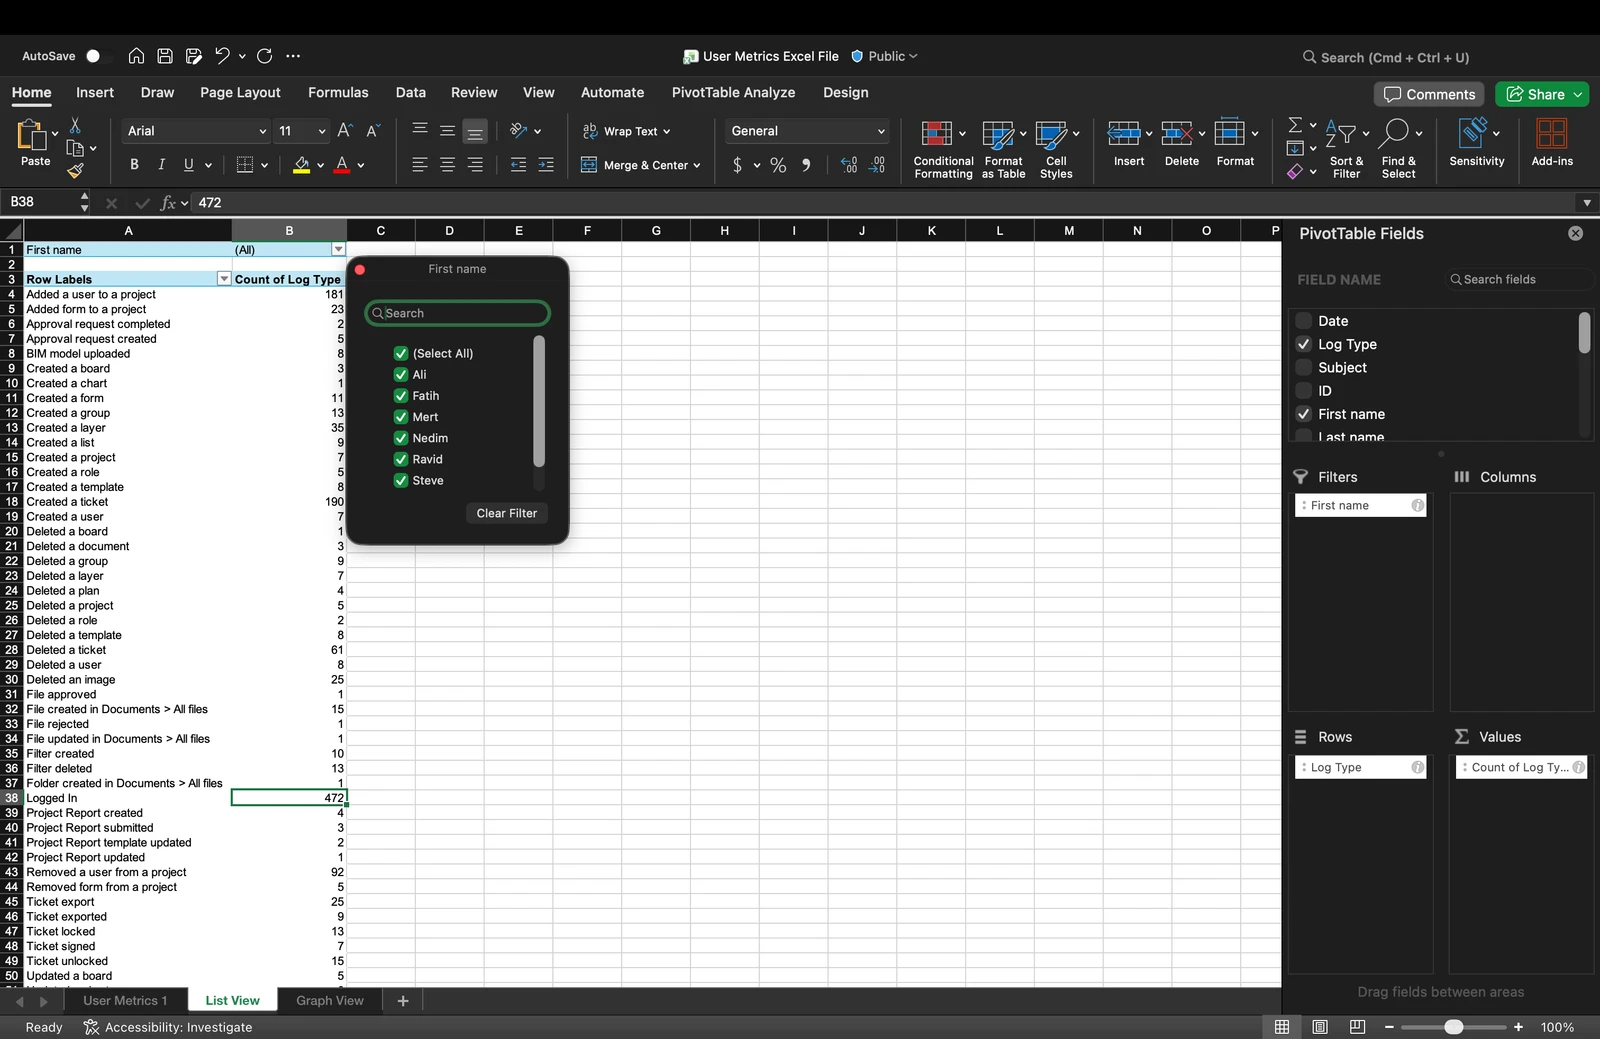
- Create pivot tables to summarize activity
- Apply filters to view specific date ranges or users
- Sort data by any column
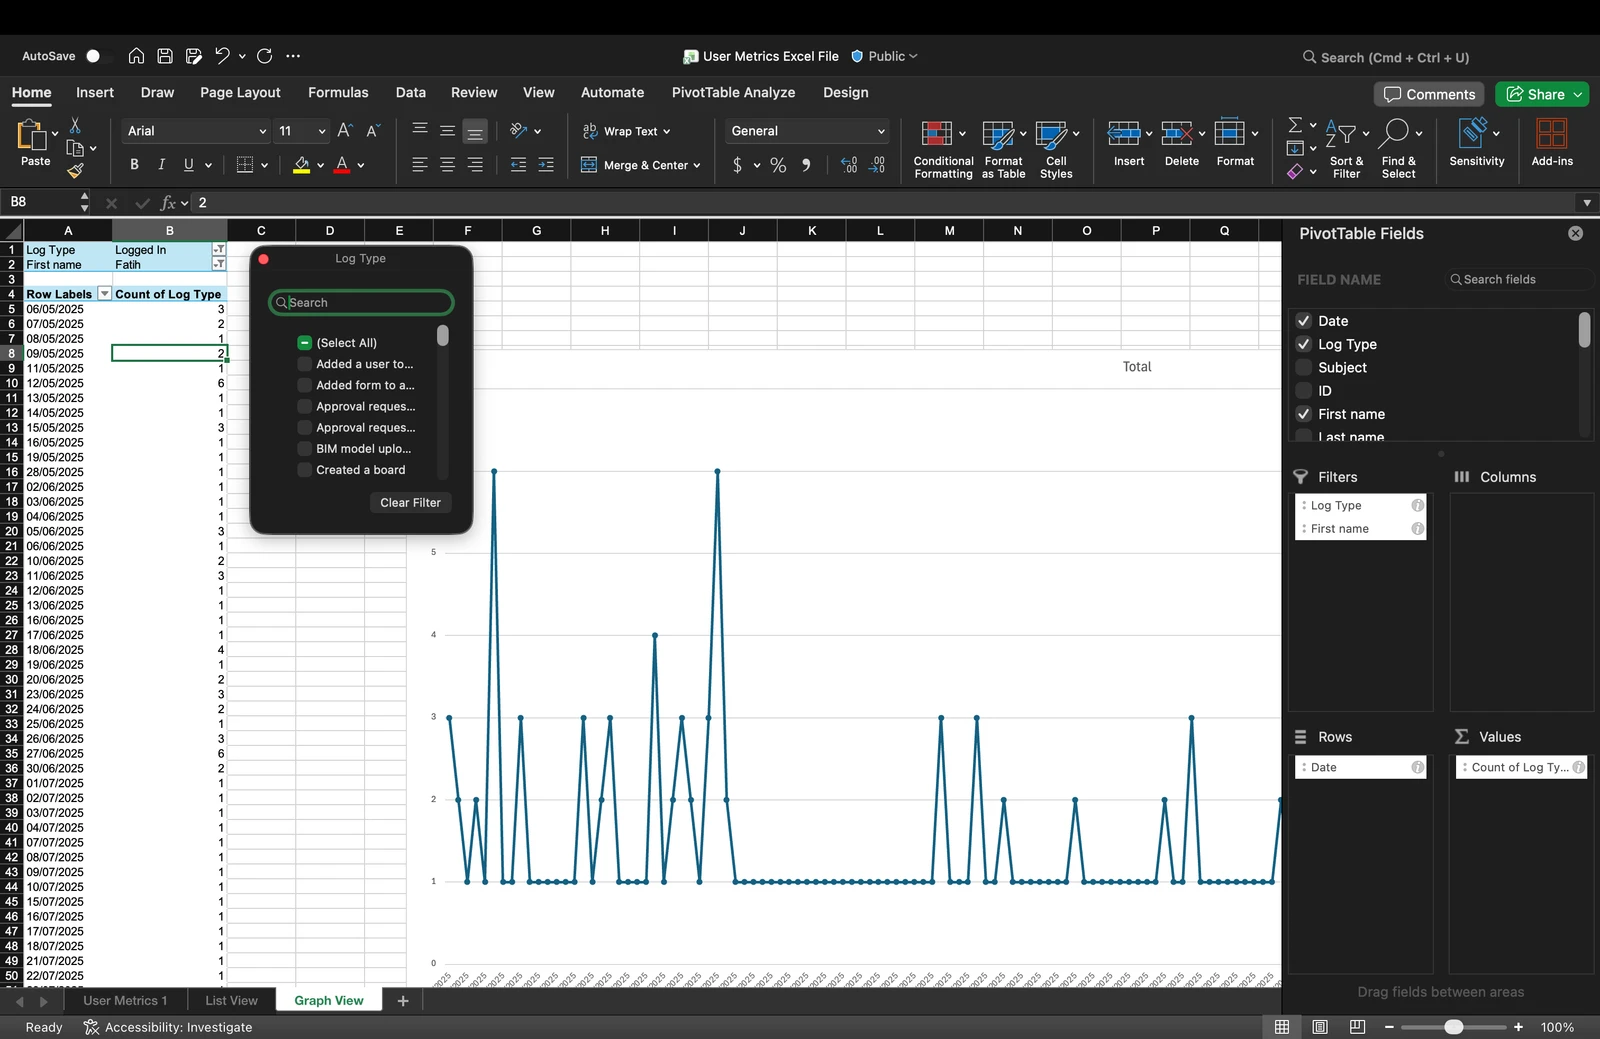
- Generate charts and graphs
Example of pivot table in Excel (List View):
Example of pivot table in Excel (Graph View):
How to access Old User Metrics
The following features apply only to the Old User Metrics page.
To access it:
- Click User Management
- Click User Metrics
- Click Old user metrics page
Show/Hide Metrics
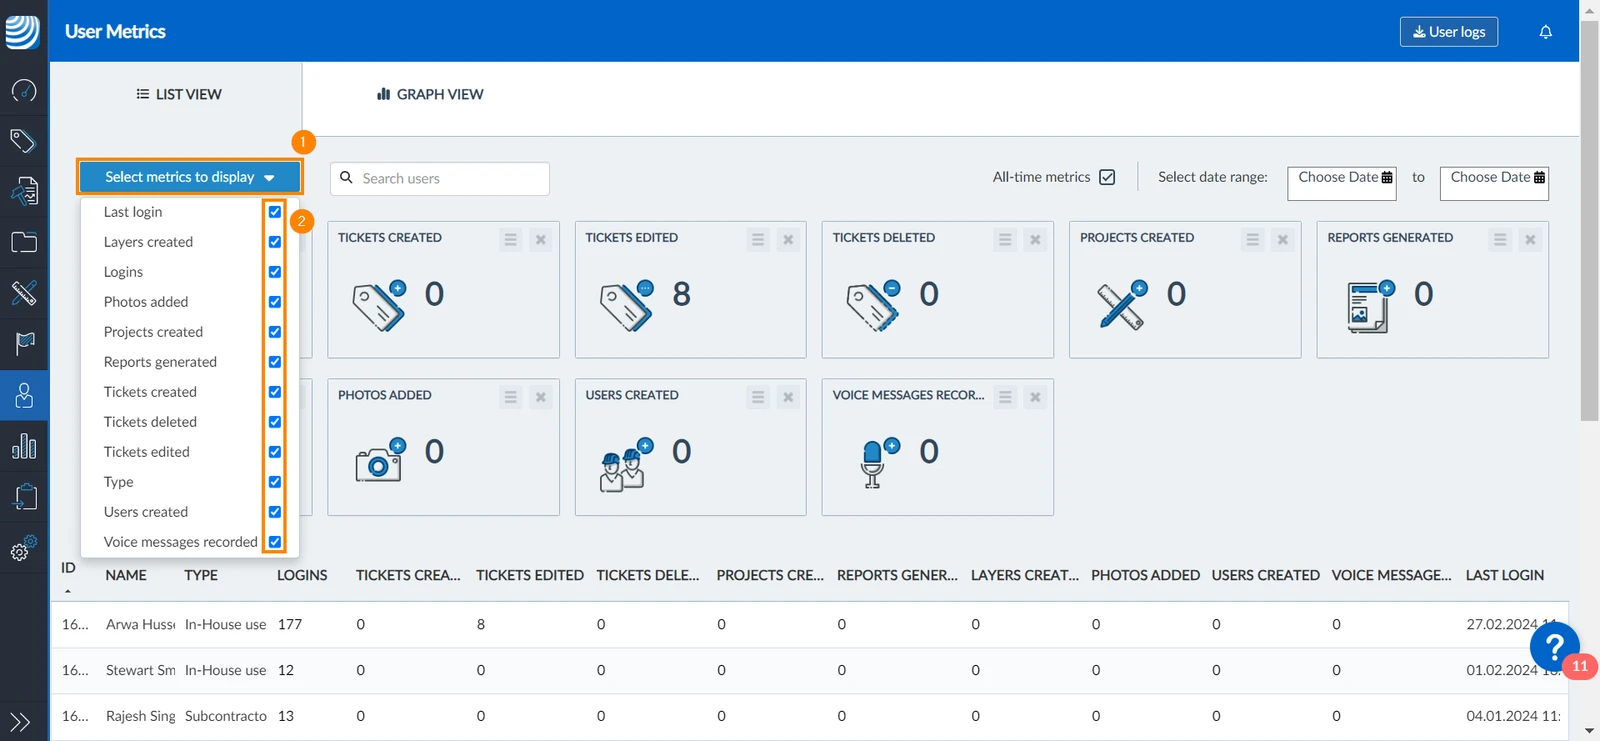
You can select which metrics to display. To do so:
- Click Select metrics to display drop-down
- Select/clear the checkbox of metrics you want to show
Show Metrics by User
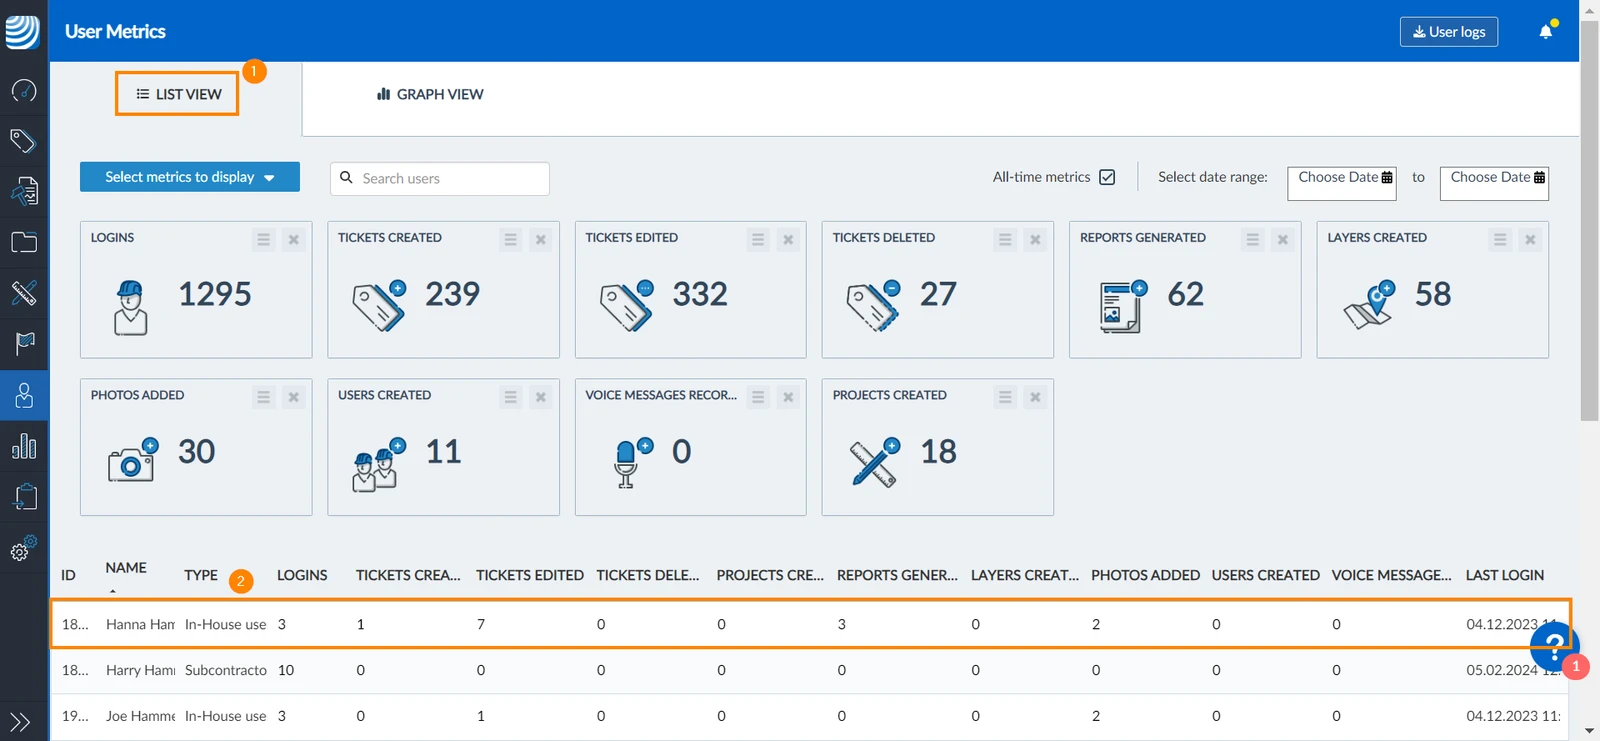
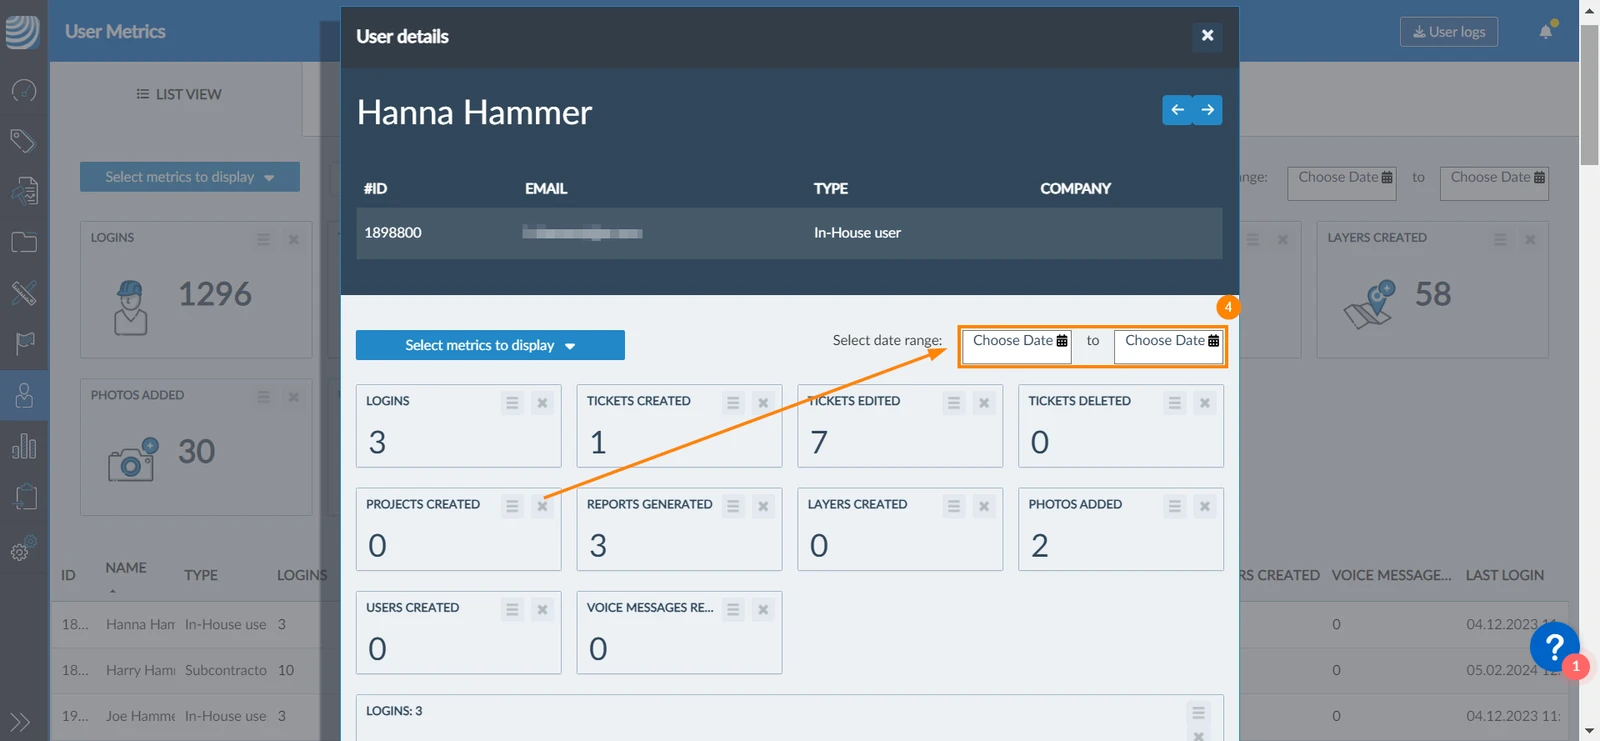
The user metrics page displays metrics for all users. However, you can select to display the metrics of a single user.
To do so:
- Click List View
- Click the user name
- A pop-up window will open displaying the user metrics details
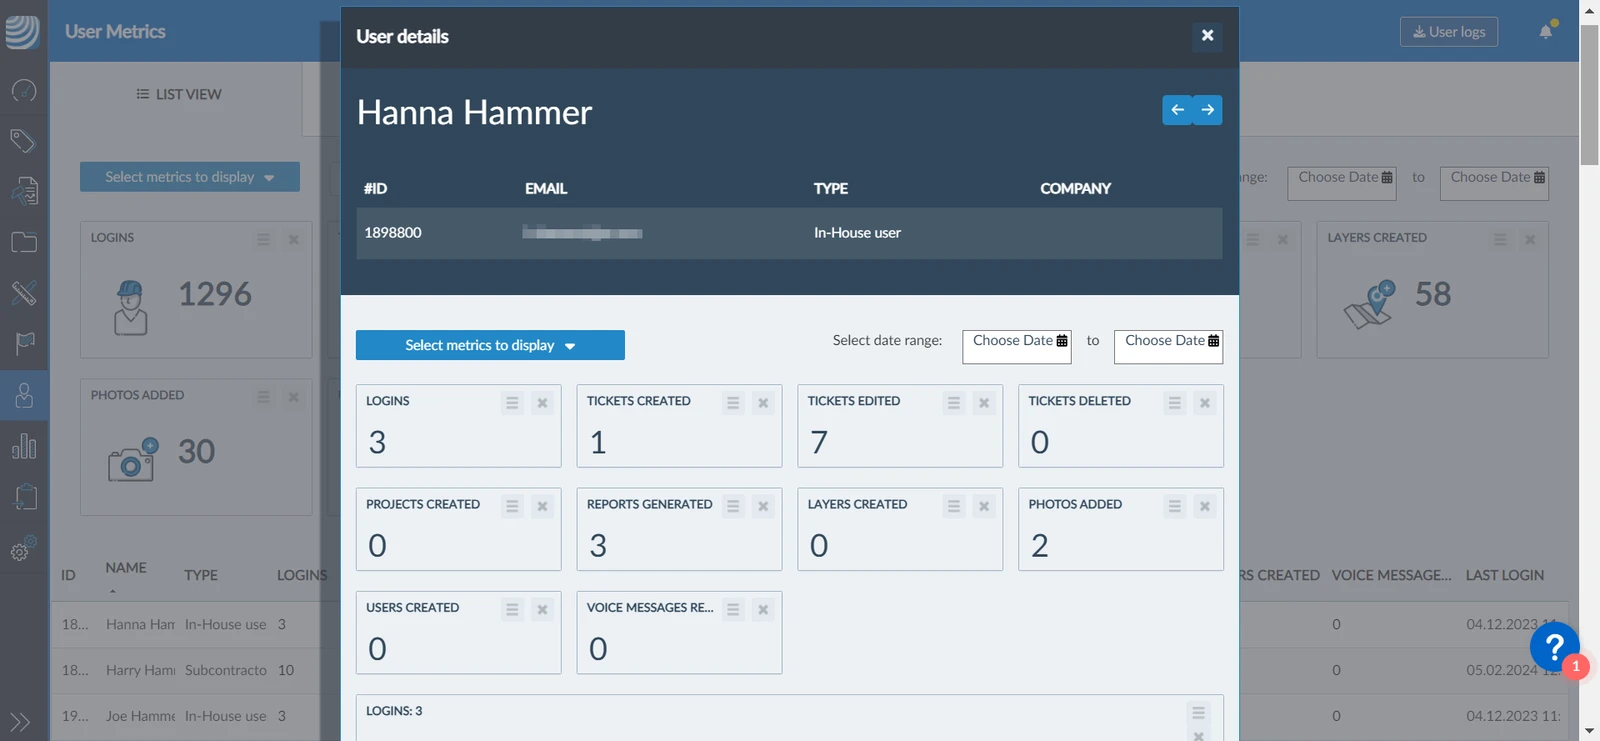
- You can use the date pickers to display only the metrics of a certain date range
Different Views
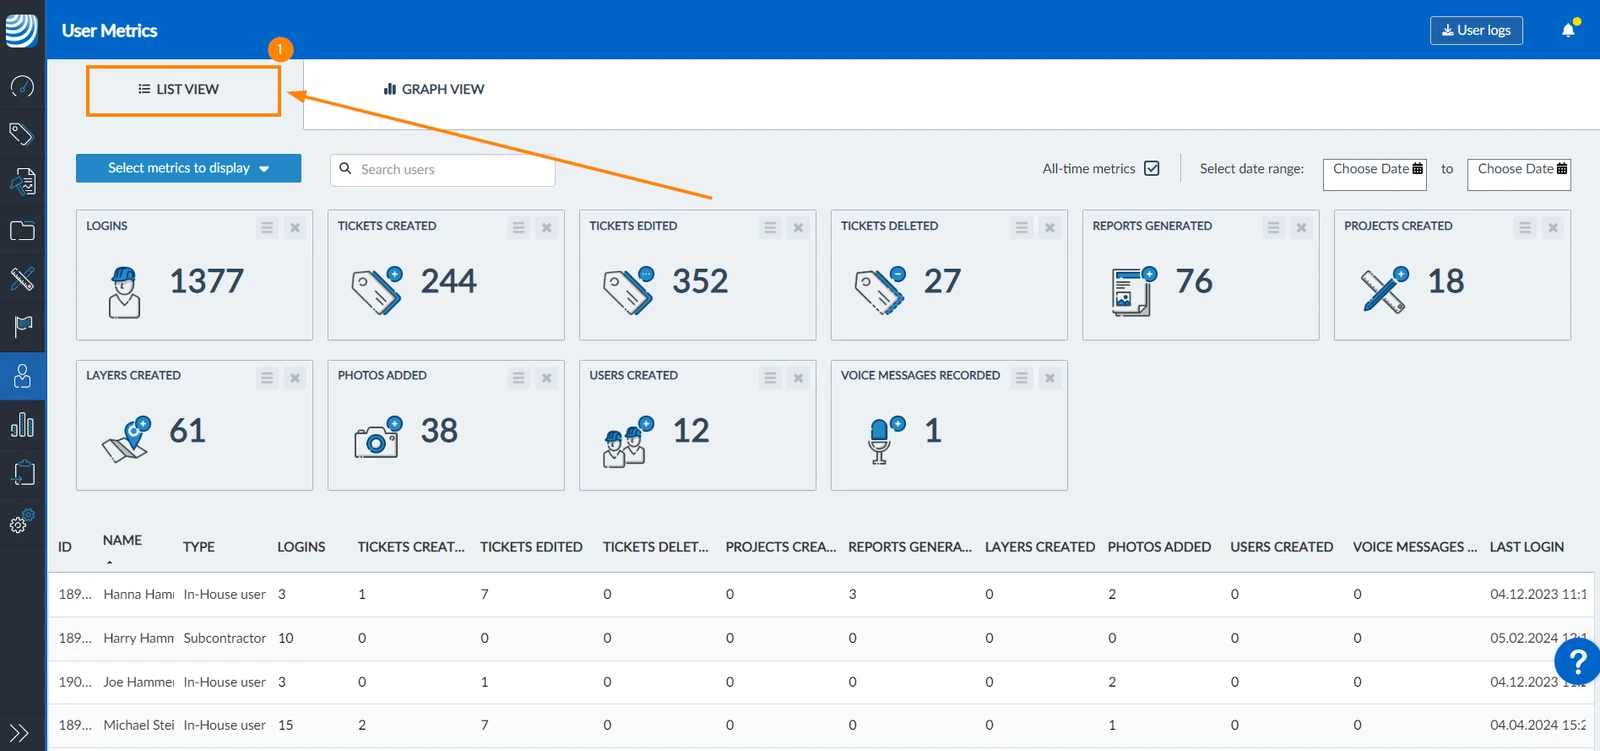
The User Metrics page offers two different views: List View and Graph View.
List View
The list view shows detailed records of the metrics per user:
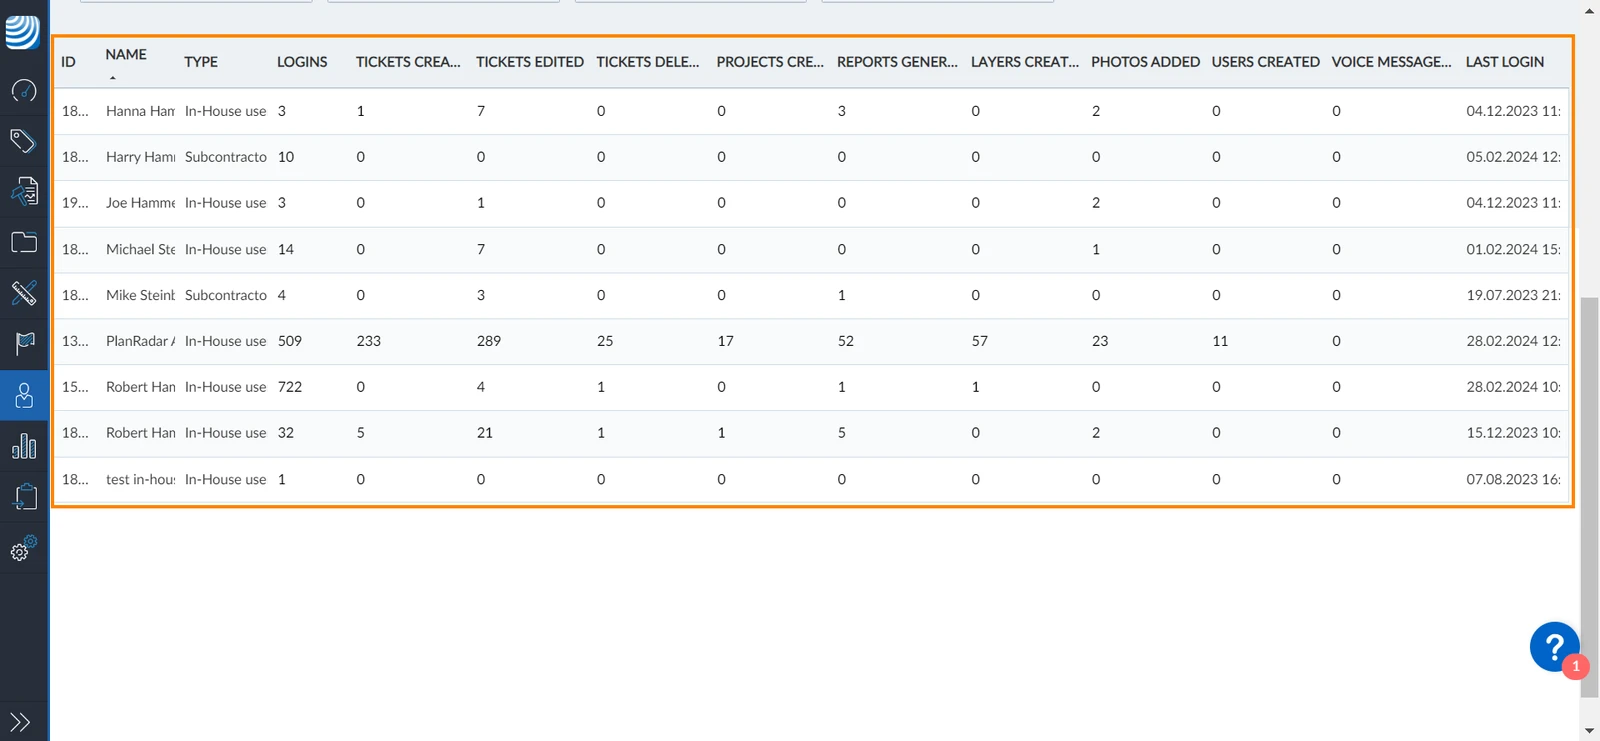
To show the list view:
- Click List View
Graph View
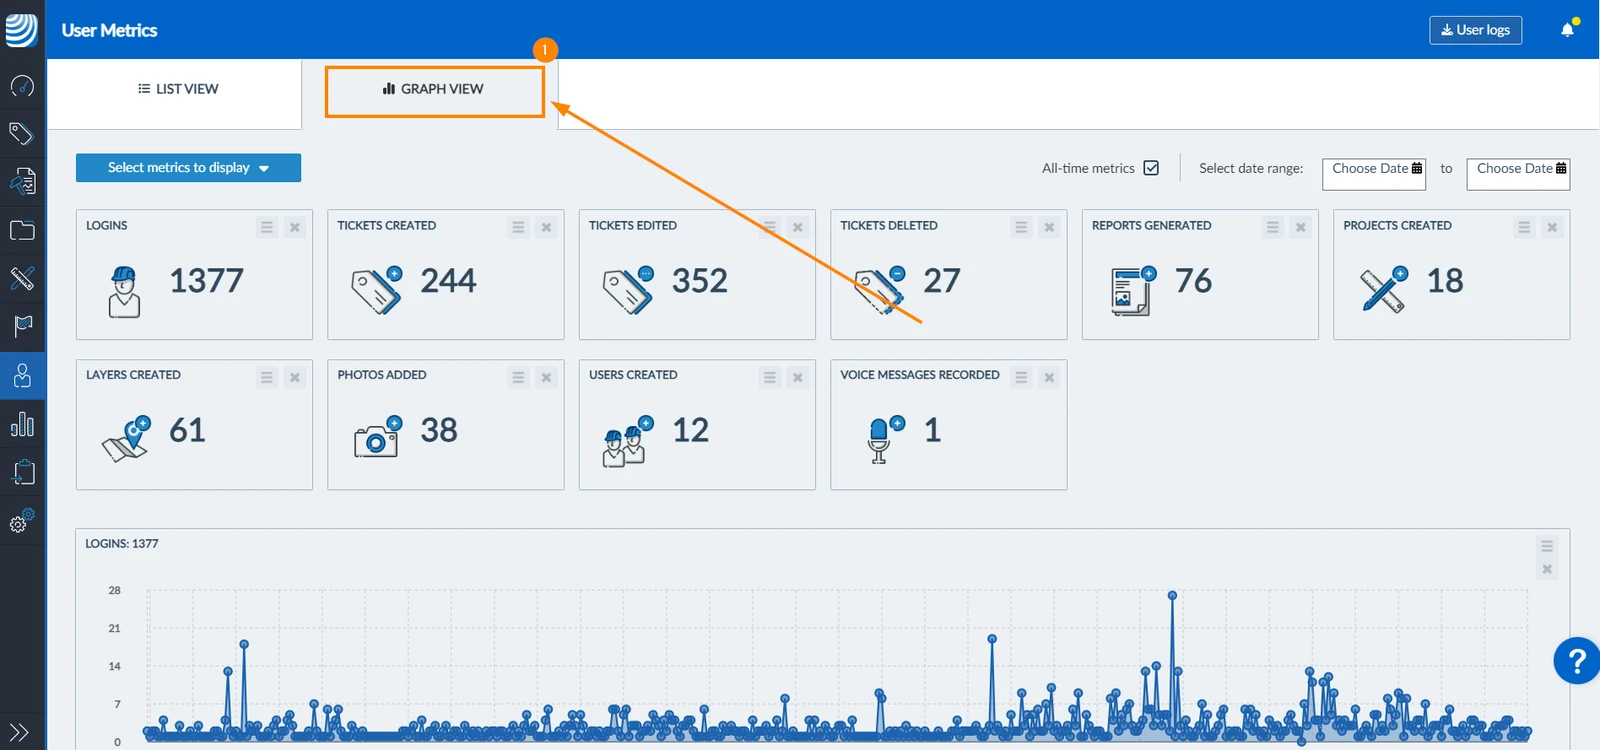
The graph view consists of multiple graphs. Each graph represents a single user metric with a timeline, showing the metric counts over time.
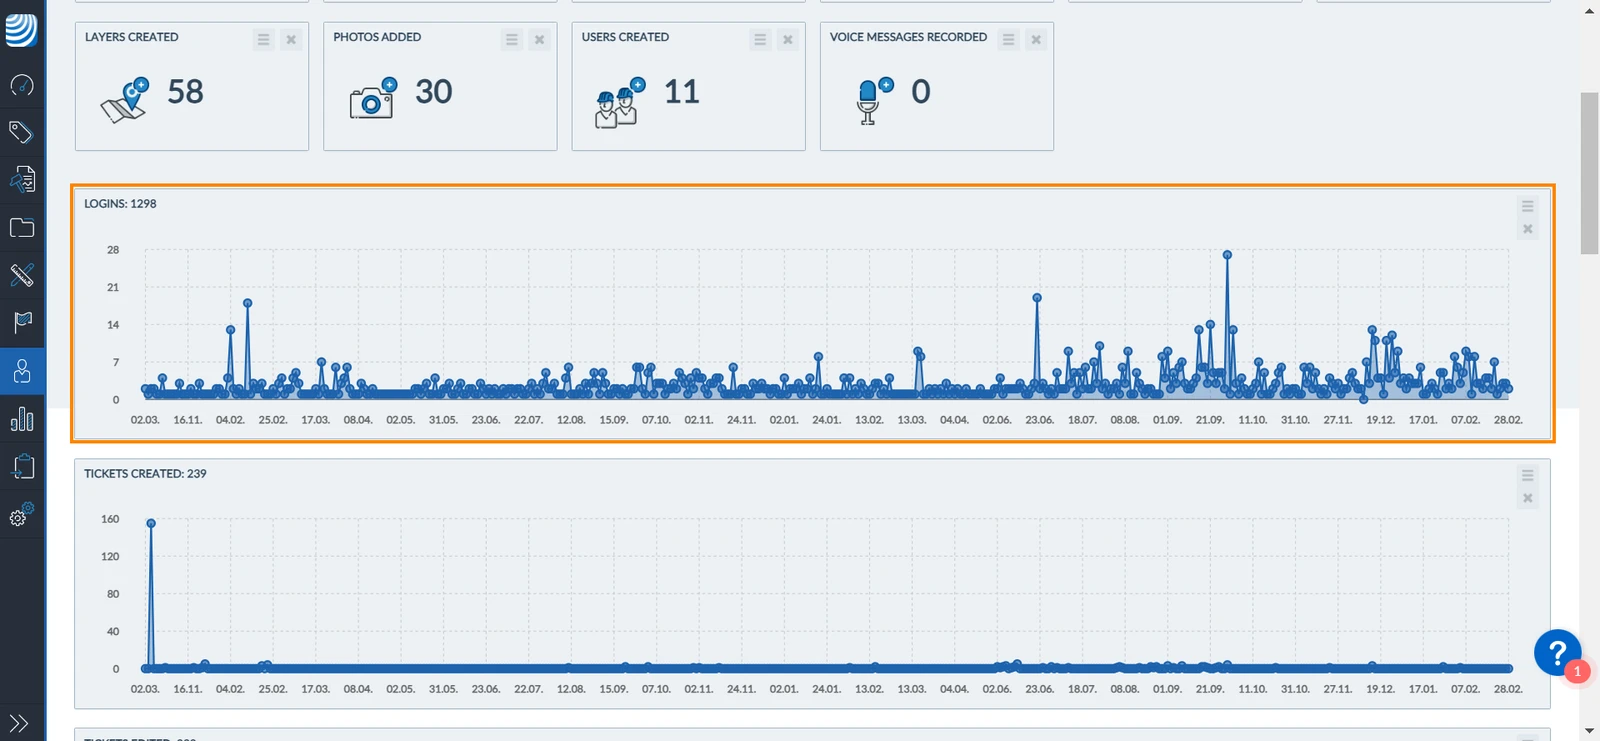
To show the graph view:
- Click Graph View
Display Metrics of a Time Period
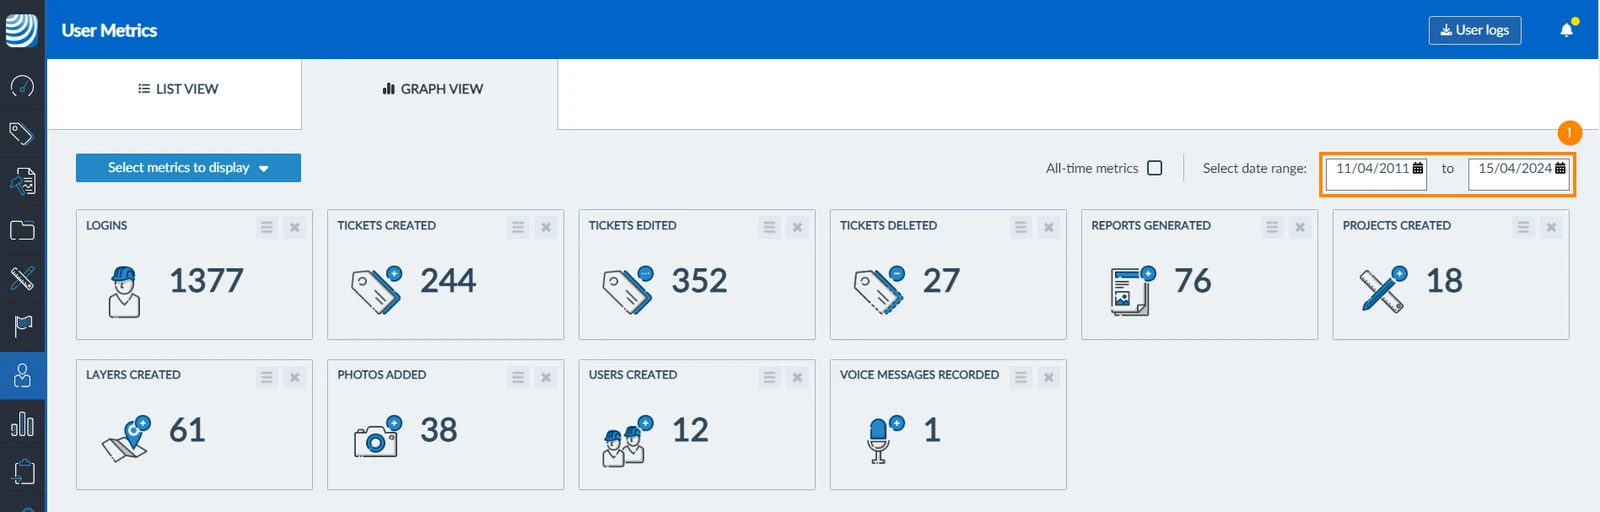
To filter user metrics in List View for a specific time period:
- Use the date pickers to select the dates (from and to) to define the date range
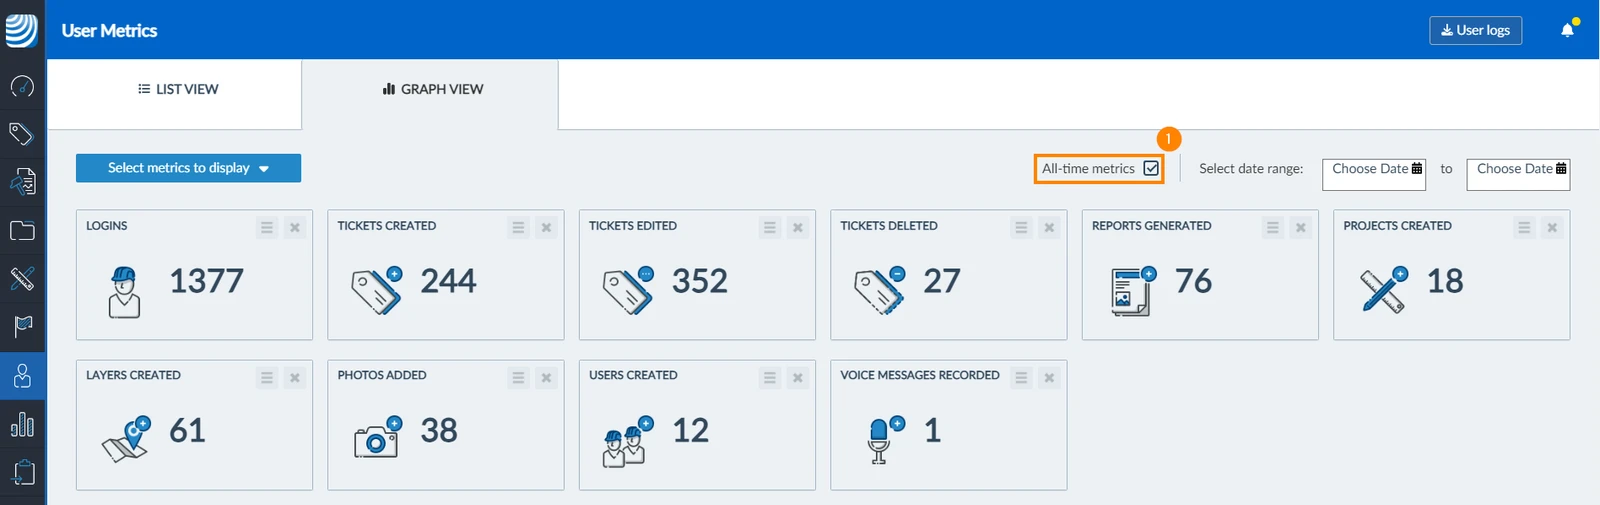
To show all the user metrics again:
- Select the All-time metrics checkbox
Updated March 5, 2026